




Poll or survey?
The distinction is mostly about intent rather than mechanics.
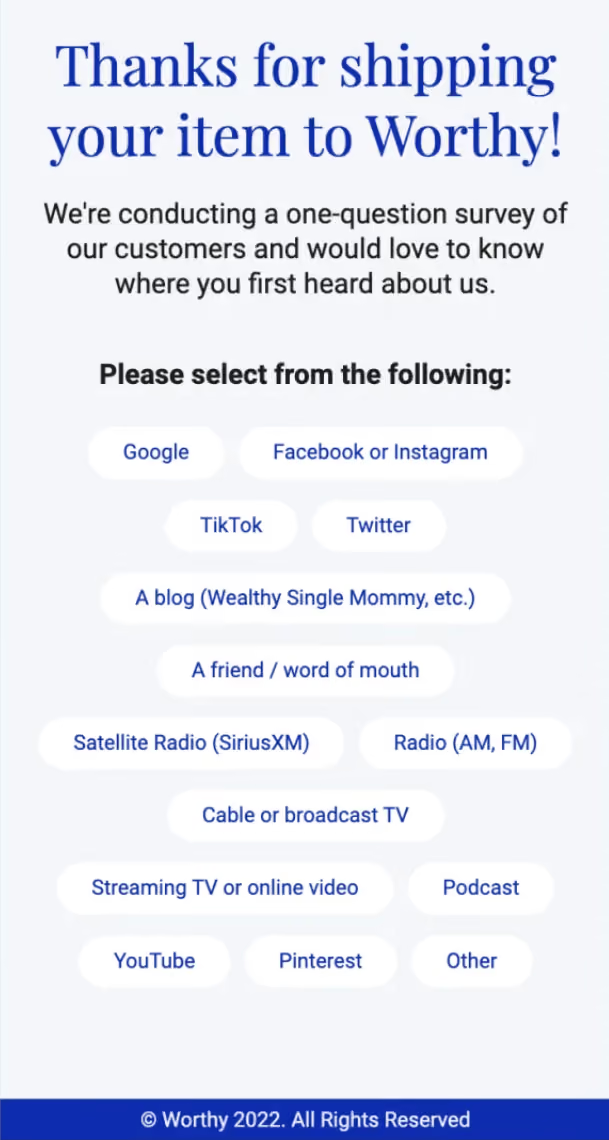
A poll is one question with fixed options, often shown publicly, answered quickly and partly for interest. A survey is for collecting information you're going to act on.
The build is identical. What differs is whether the answer does anything afterwards — and that's the decision worth making before you launch, not after.
Why polls get high response rates
Three reasons, and they're worth understanding because they're borrowable.
- One question. No commitment, no scroll, no form.
- Fixed options. Tap and done — no typing.
- Curiosity. If results are shown, answering buys you something.
That third one is the poll's distinctive mechanic, and it has a cost — covered below.
Step 1: Build the poll
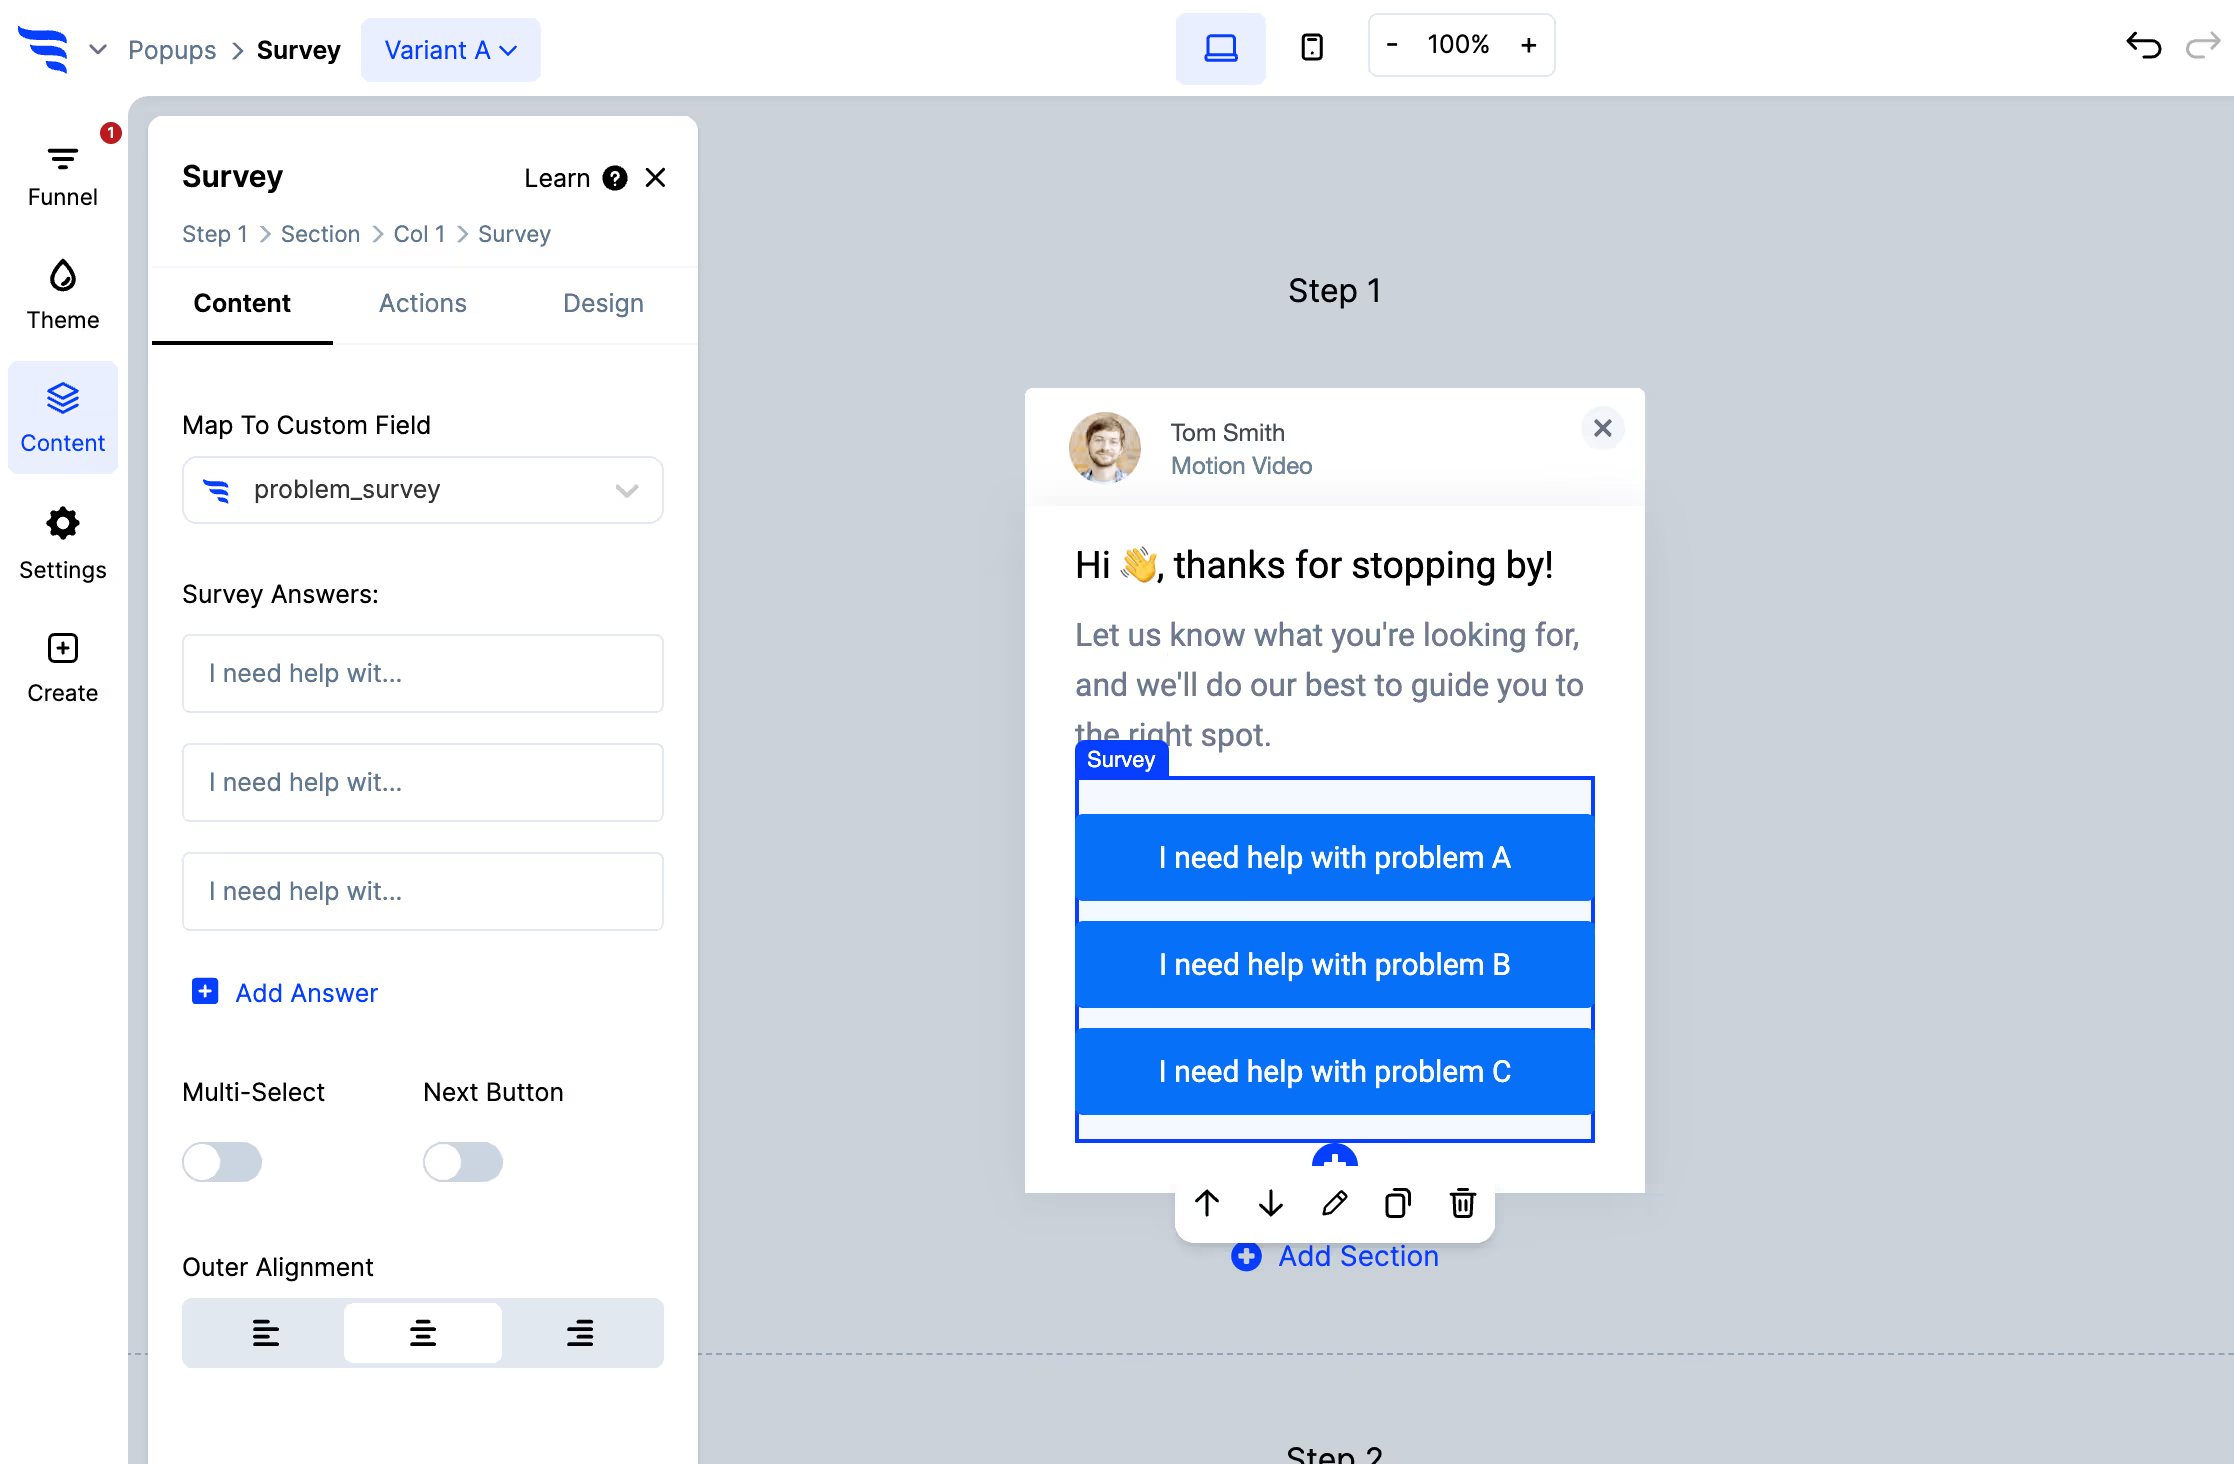
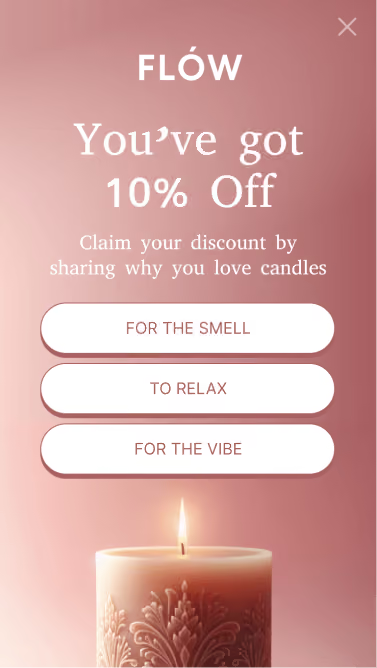
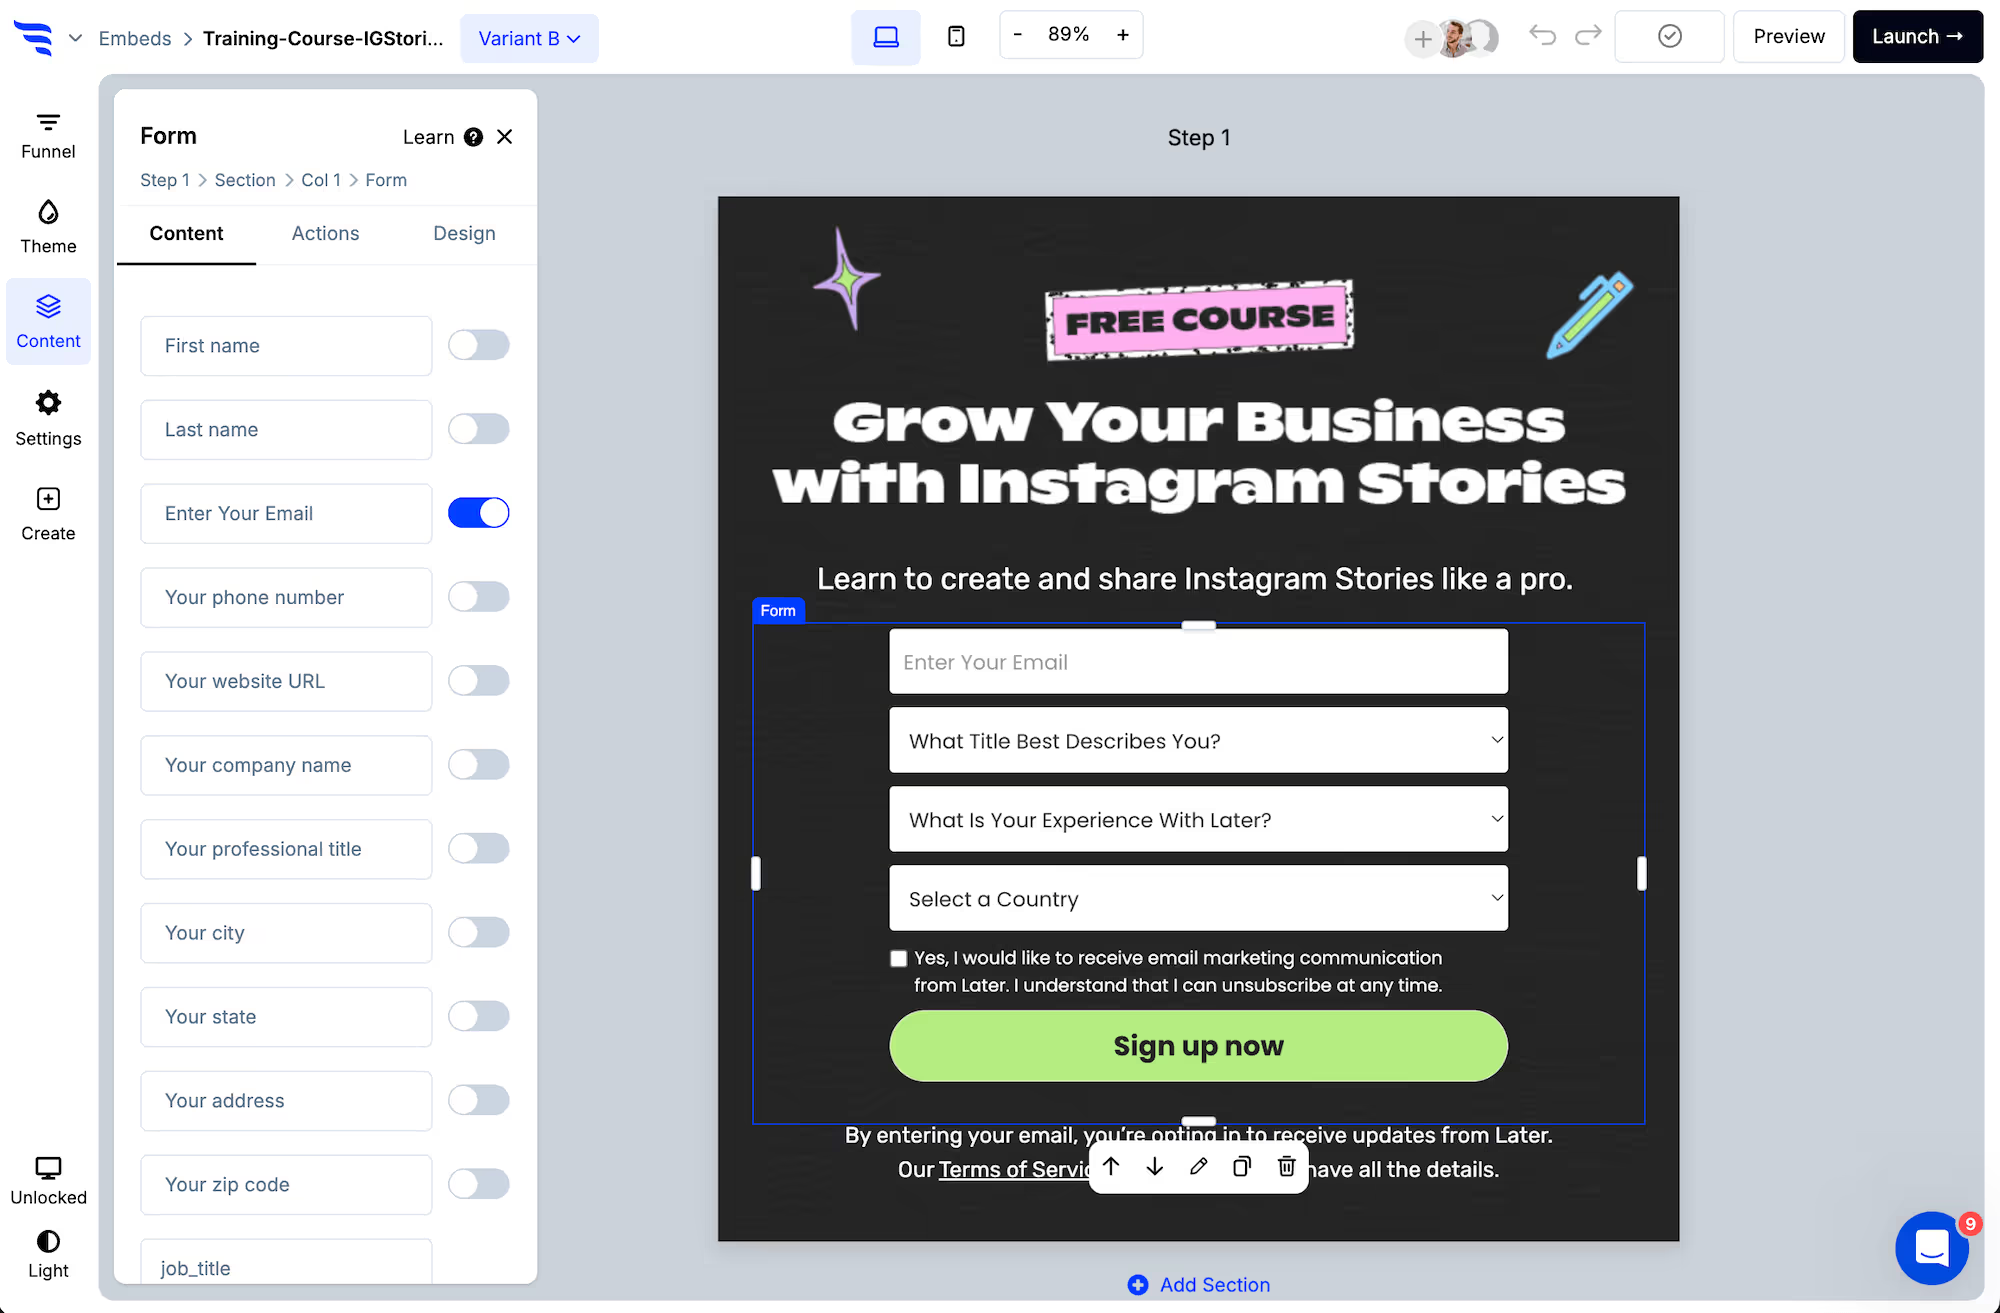
Add a survey element to a page, popup or embed. Keep to three or four options — a poll with eight is a survey wearing a costume.
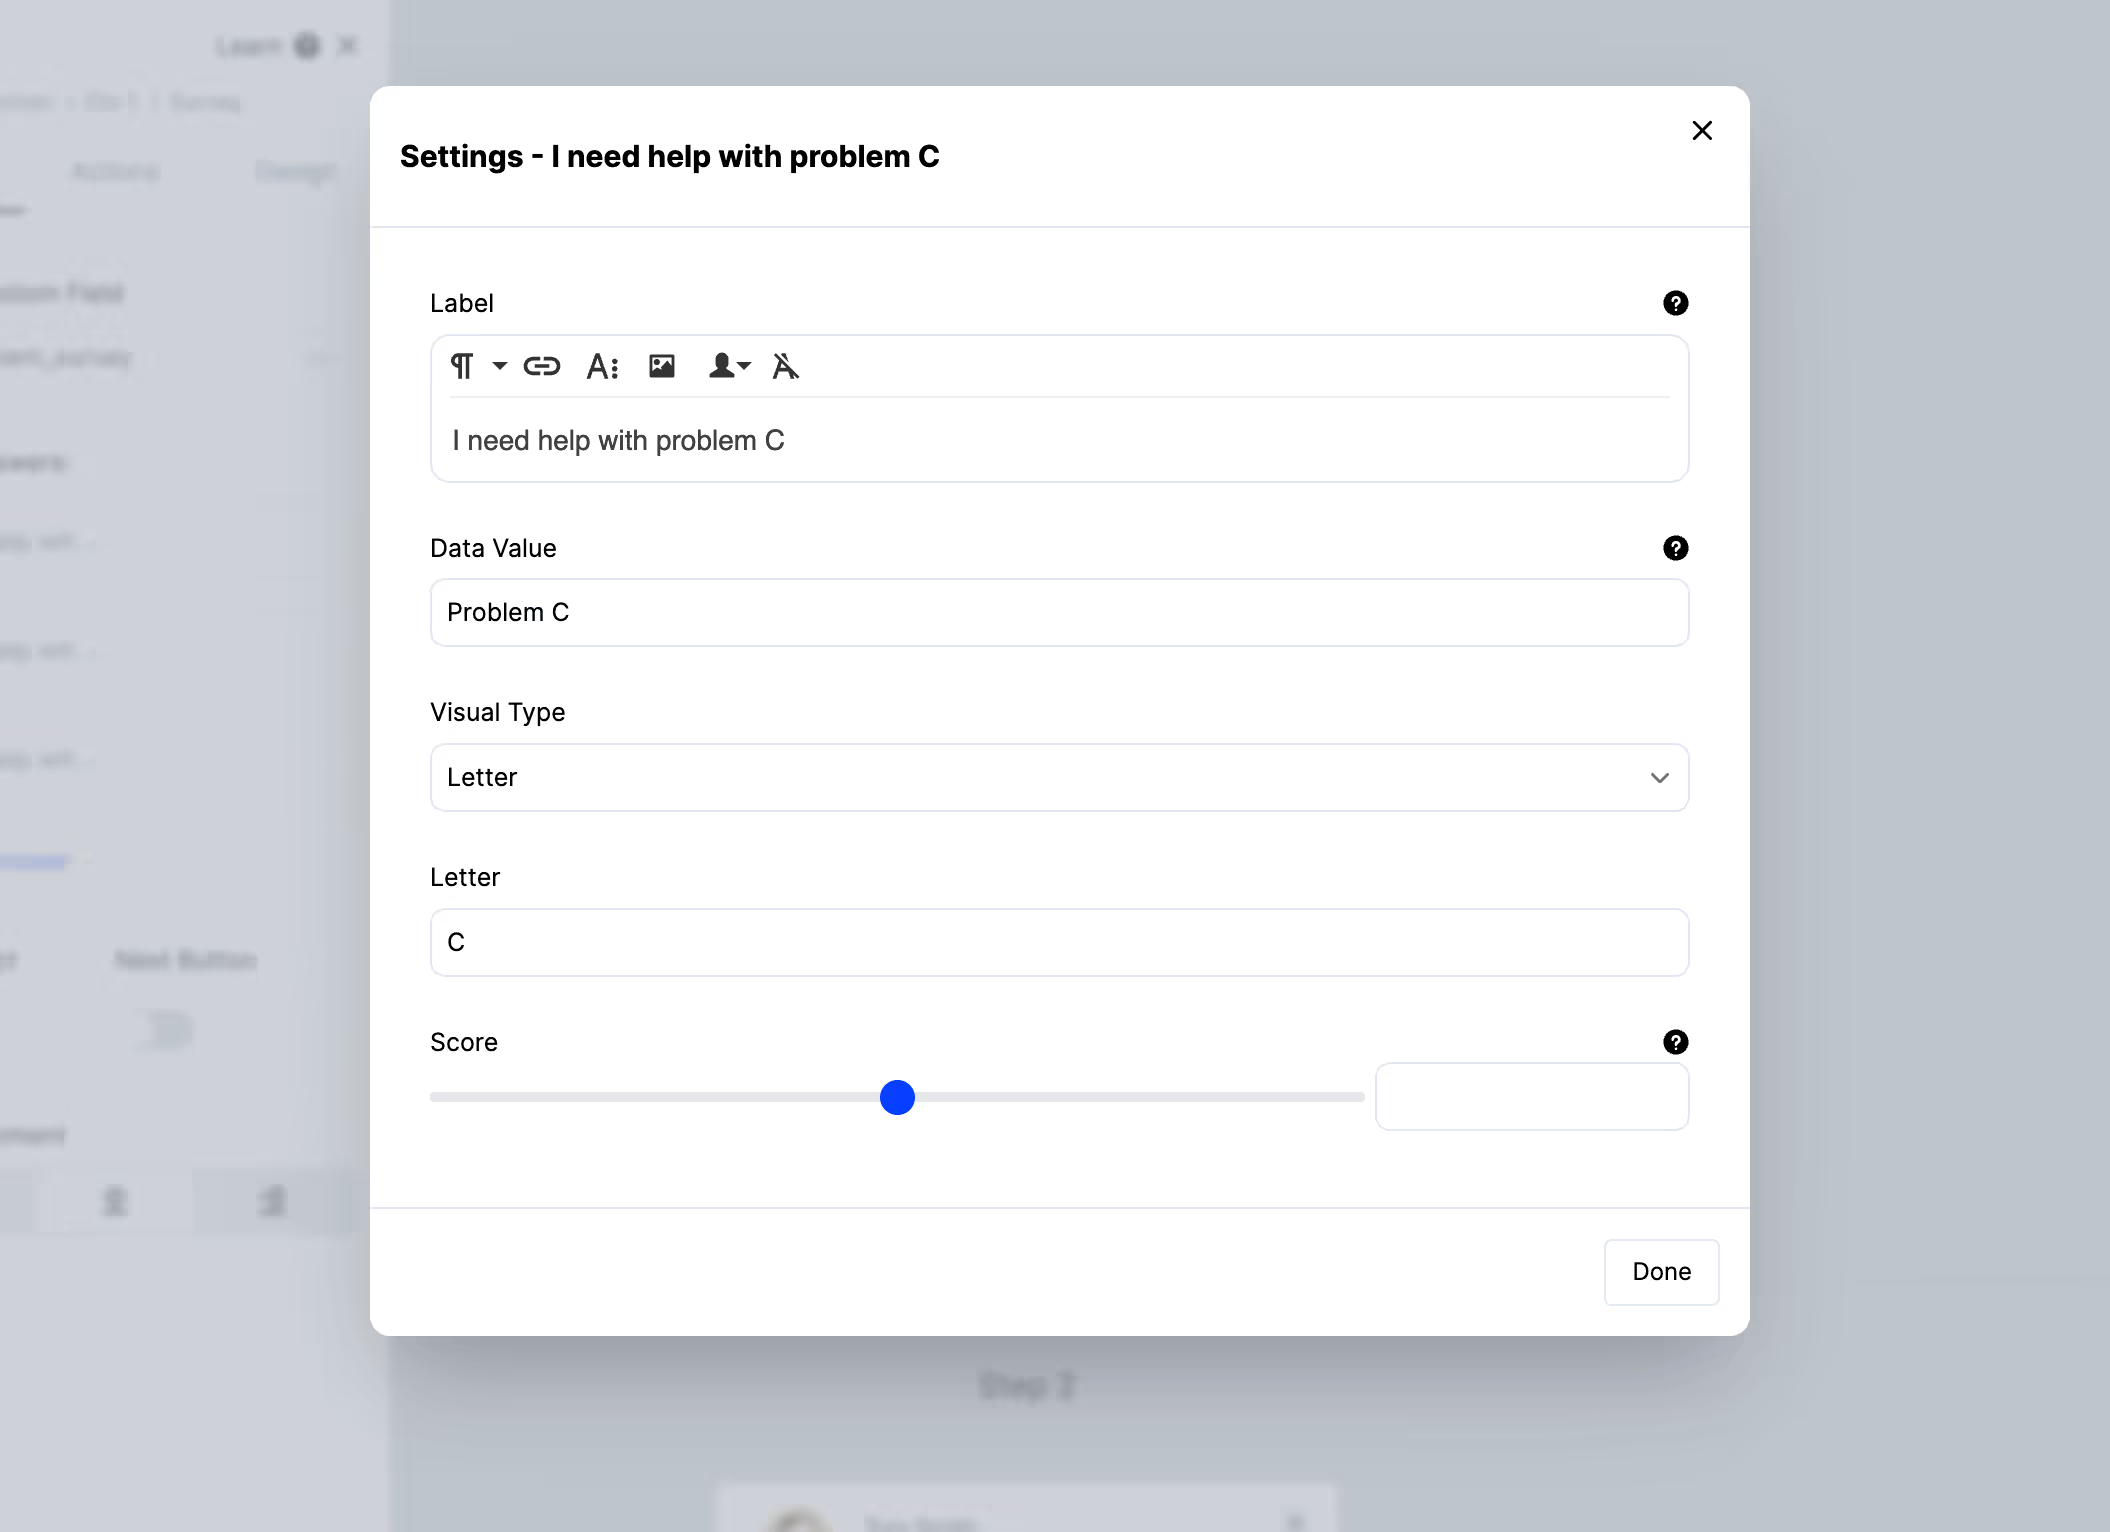
Set the data value separately from the label, so a casual-sounding option still stores as something you can segment on.
Step 2: Decide about showing results — carefully
Revealing the tally is what makes a poll feel like a poll, and it raises participation.
It also changes the answers. People conform to a visible majority, so a poll that shows a running total is measuring something other than independent opinion.
The rule worth following: if you'll act on the data, don't show results before someone answers. Reveal afterwards if you want the engagement — by then their answer is recorded.
If it's purely for engagement, show whatever you like.
Step 3: Style it lightly
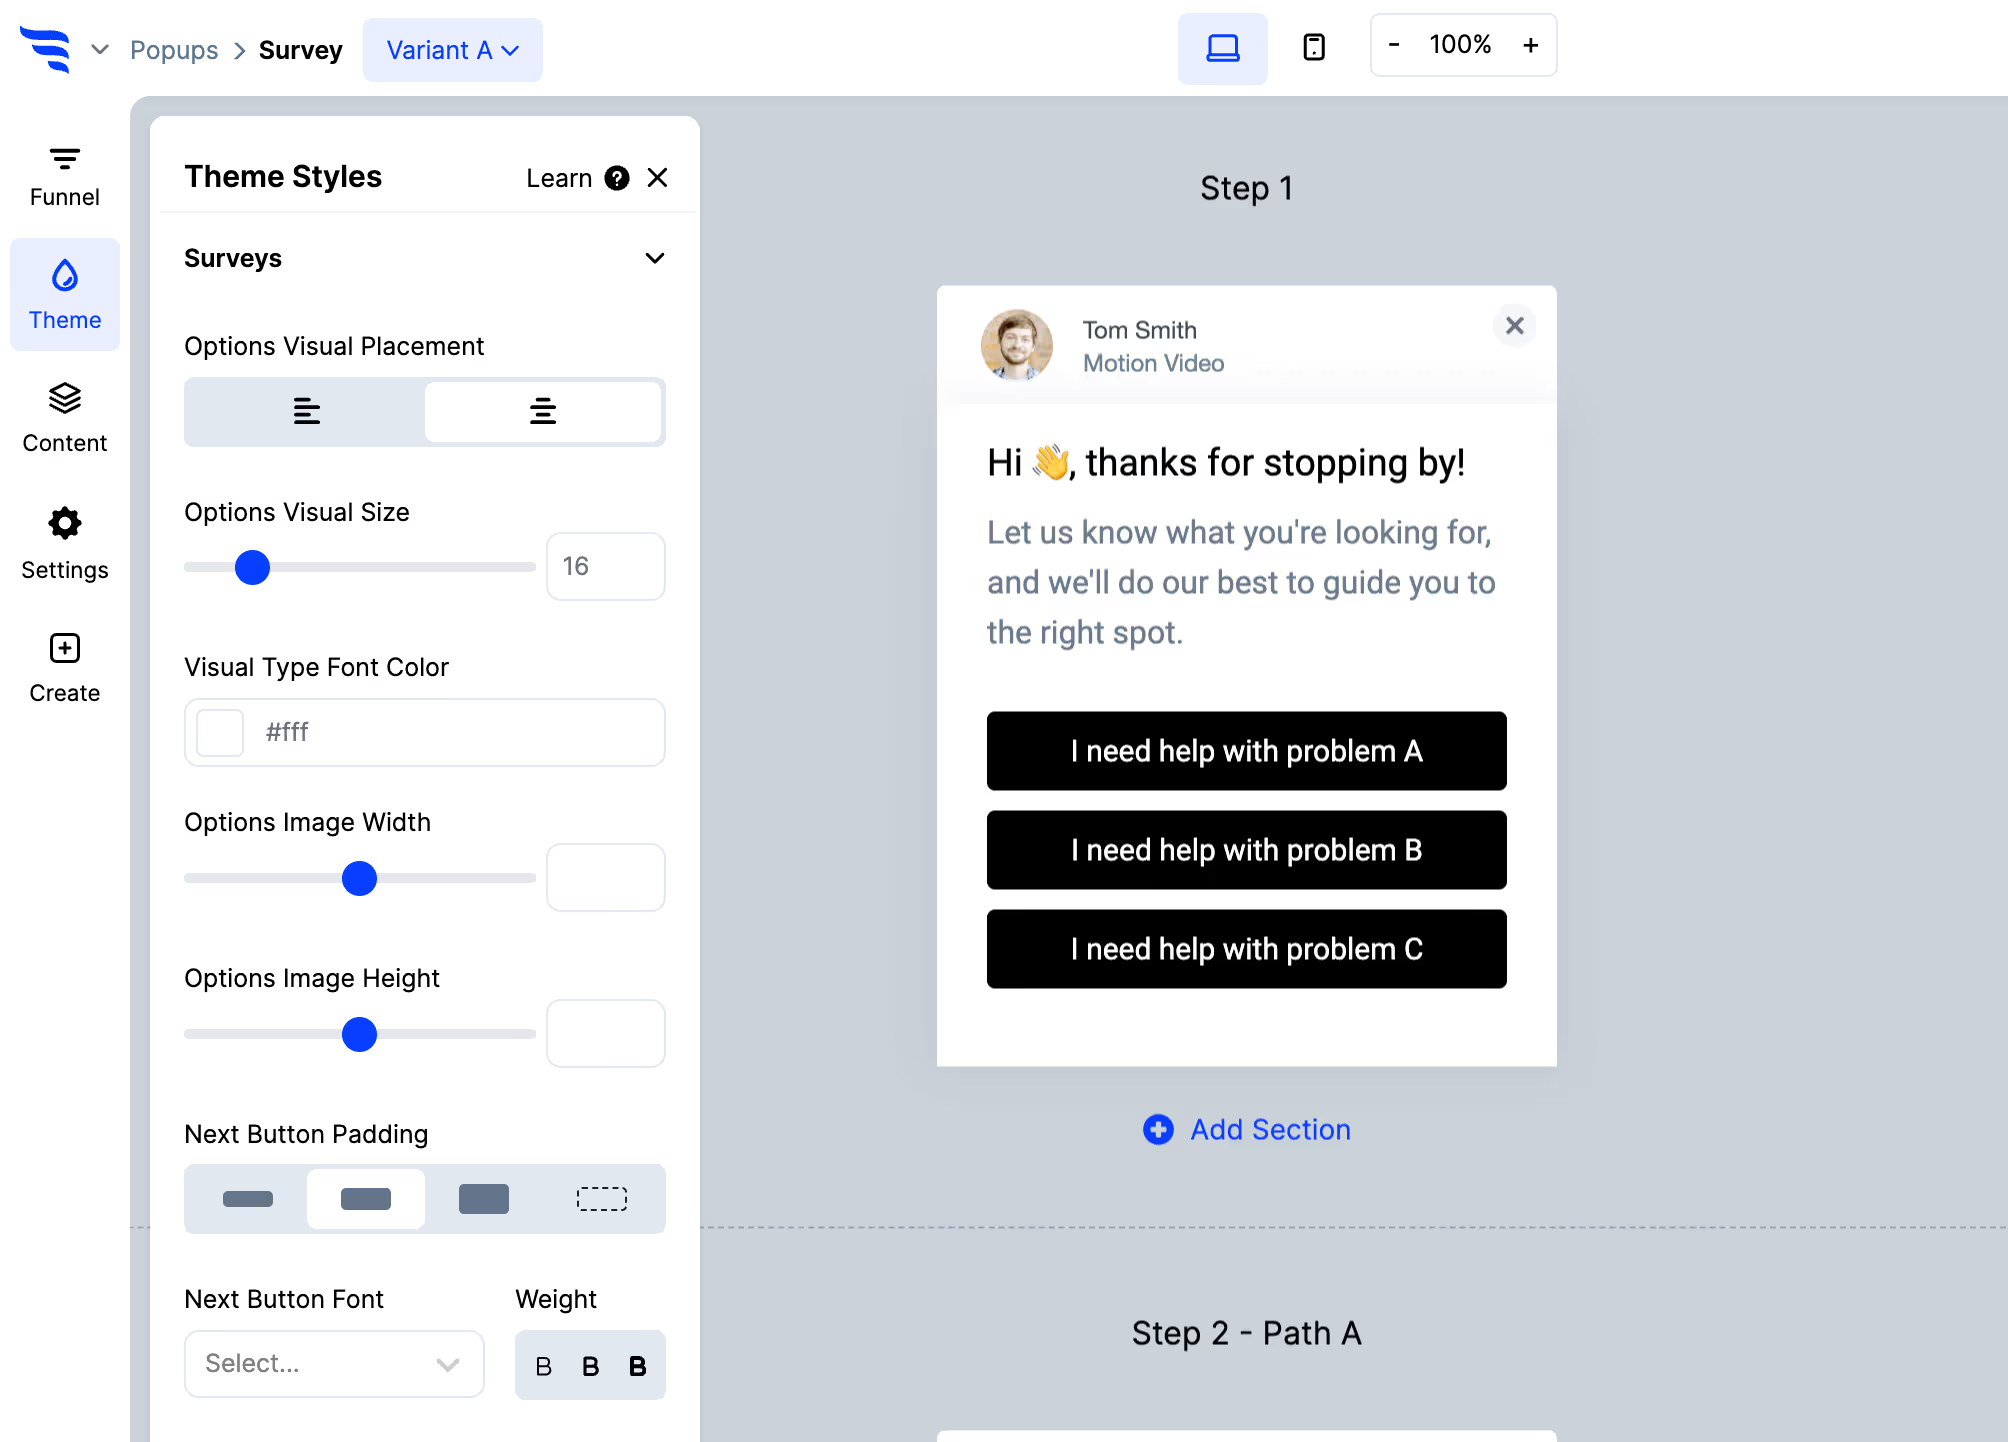
A poll should look casual — that's what signals it takes two seconds. Styled like a research instrument, it gets treated like one and answered less.
Step 4: Place it where the question fits the page
Polls work where the topic is already on the visitor's mind:
- Inside a blog post — on the thing the post is about
- On a category page — preference between options
- After an event or launch — reaction while it's fresh
A poll unrelated to the page it sits on gets ignored, however light it looks.
Step 5: Make the answer count for something
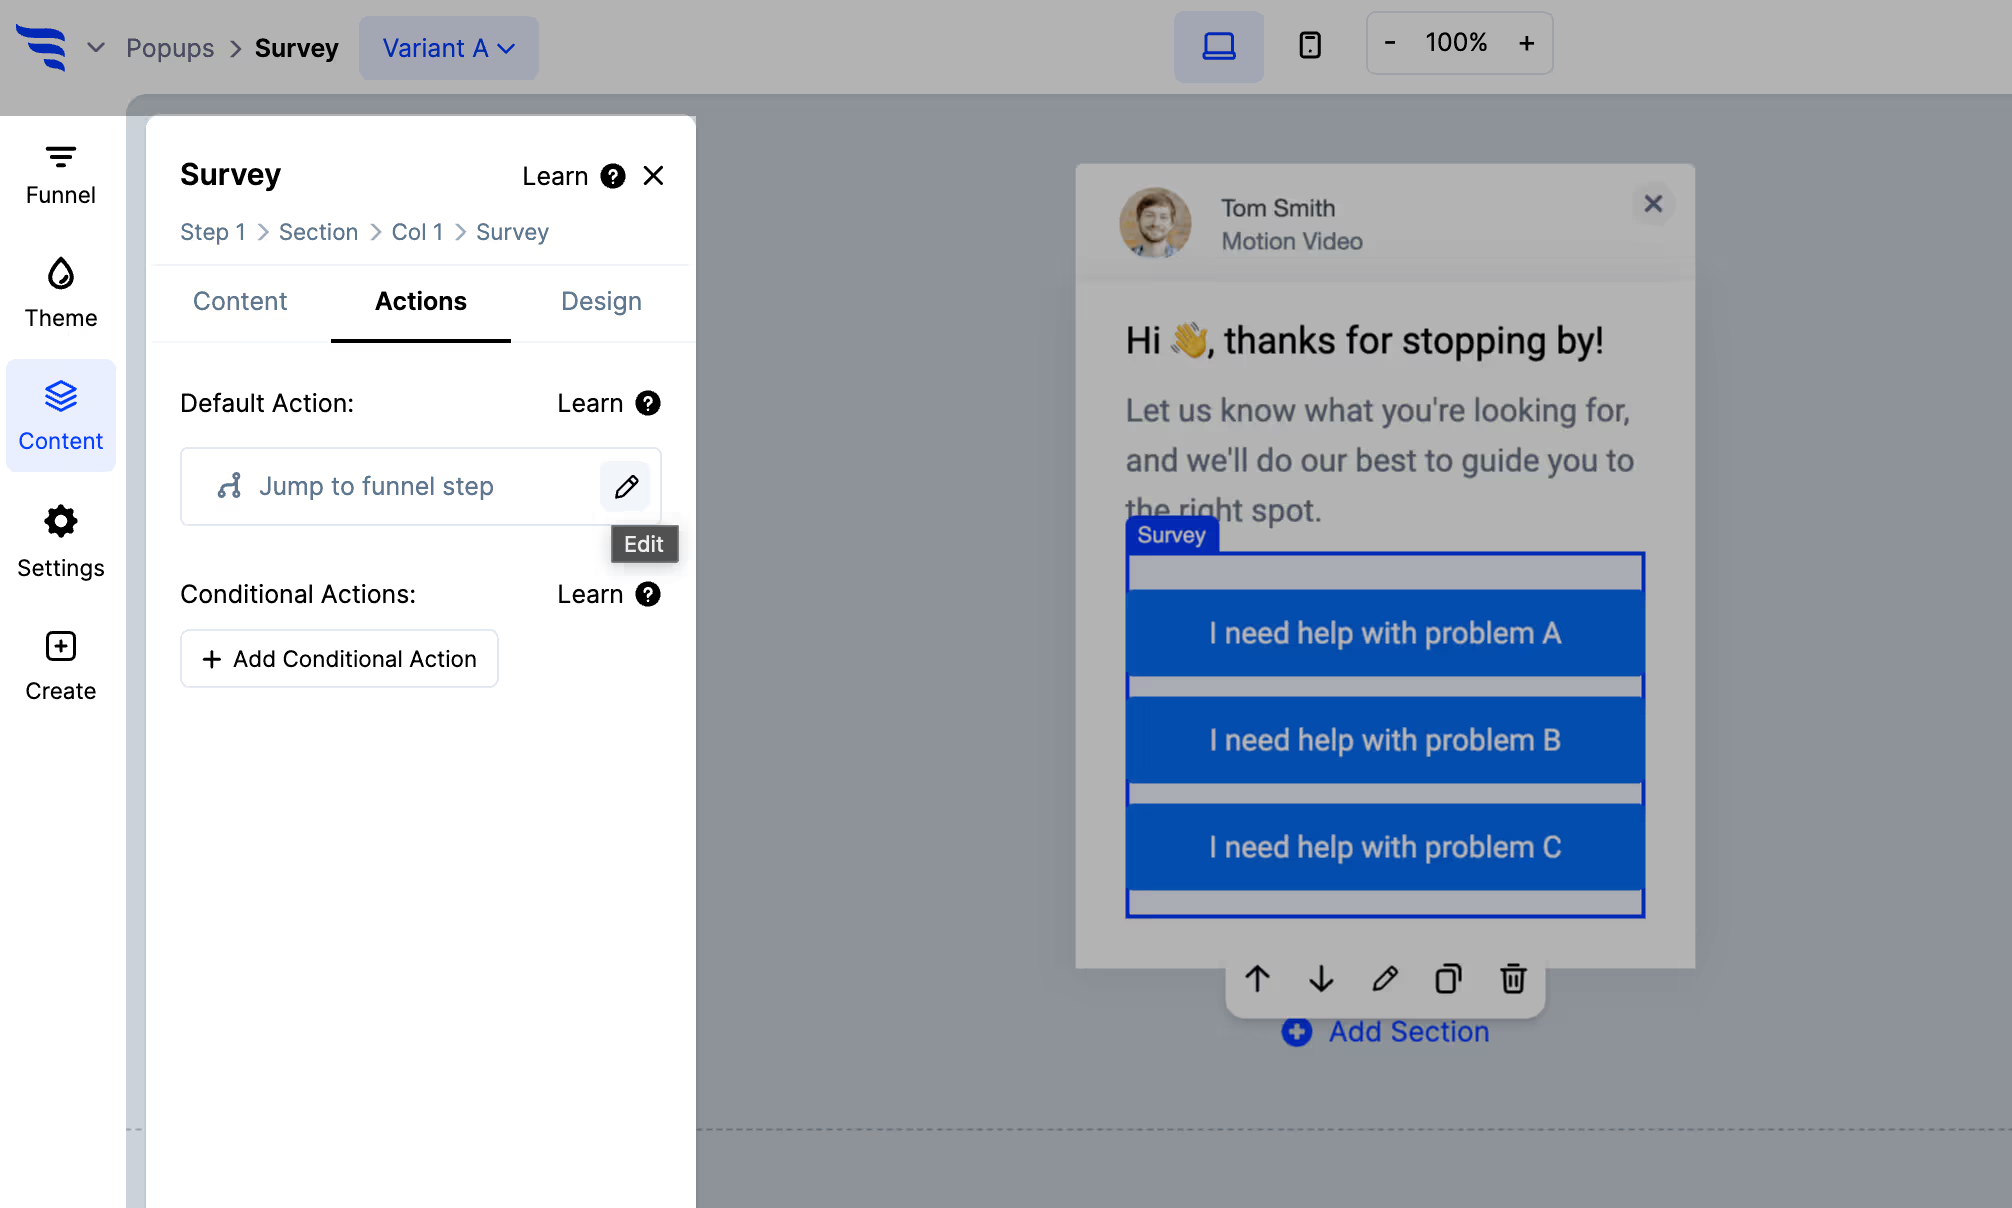
This is the step that separates a poll worth running from a widget.
Map the answer to a field or tag in your email platform. A preference poll on a category page tells you what each respondent leans toward — which is genuinely useful segmentation collected at almost no cost in friction.
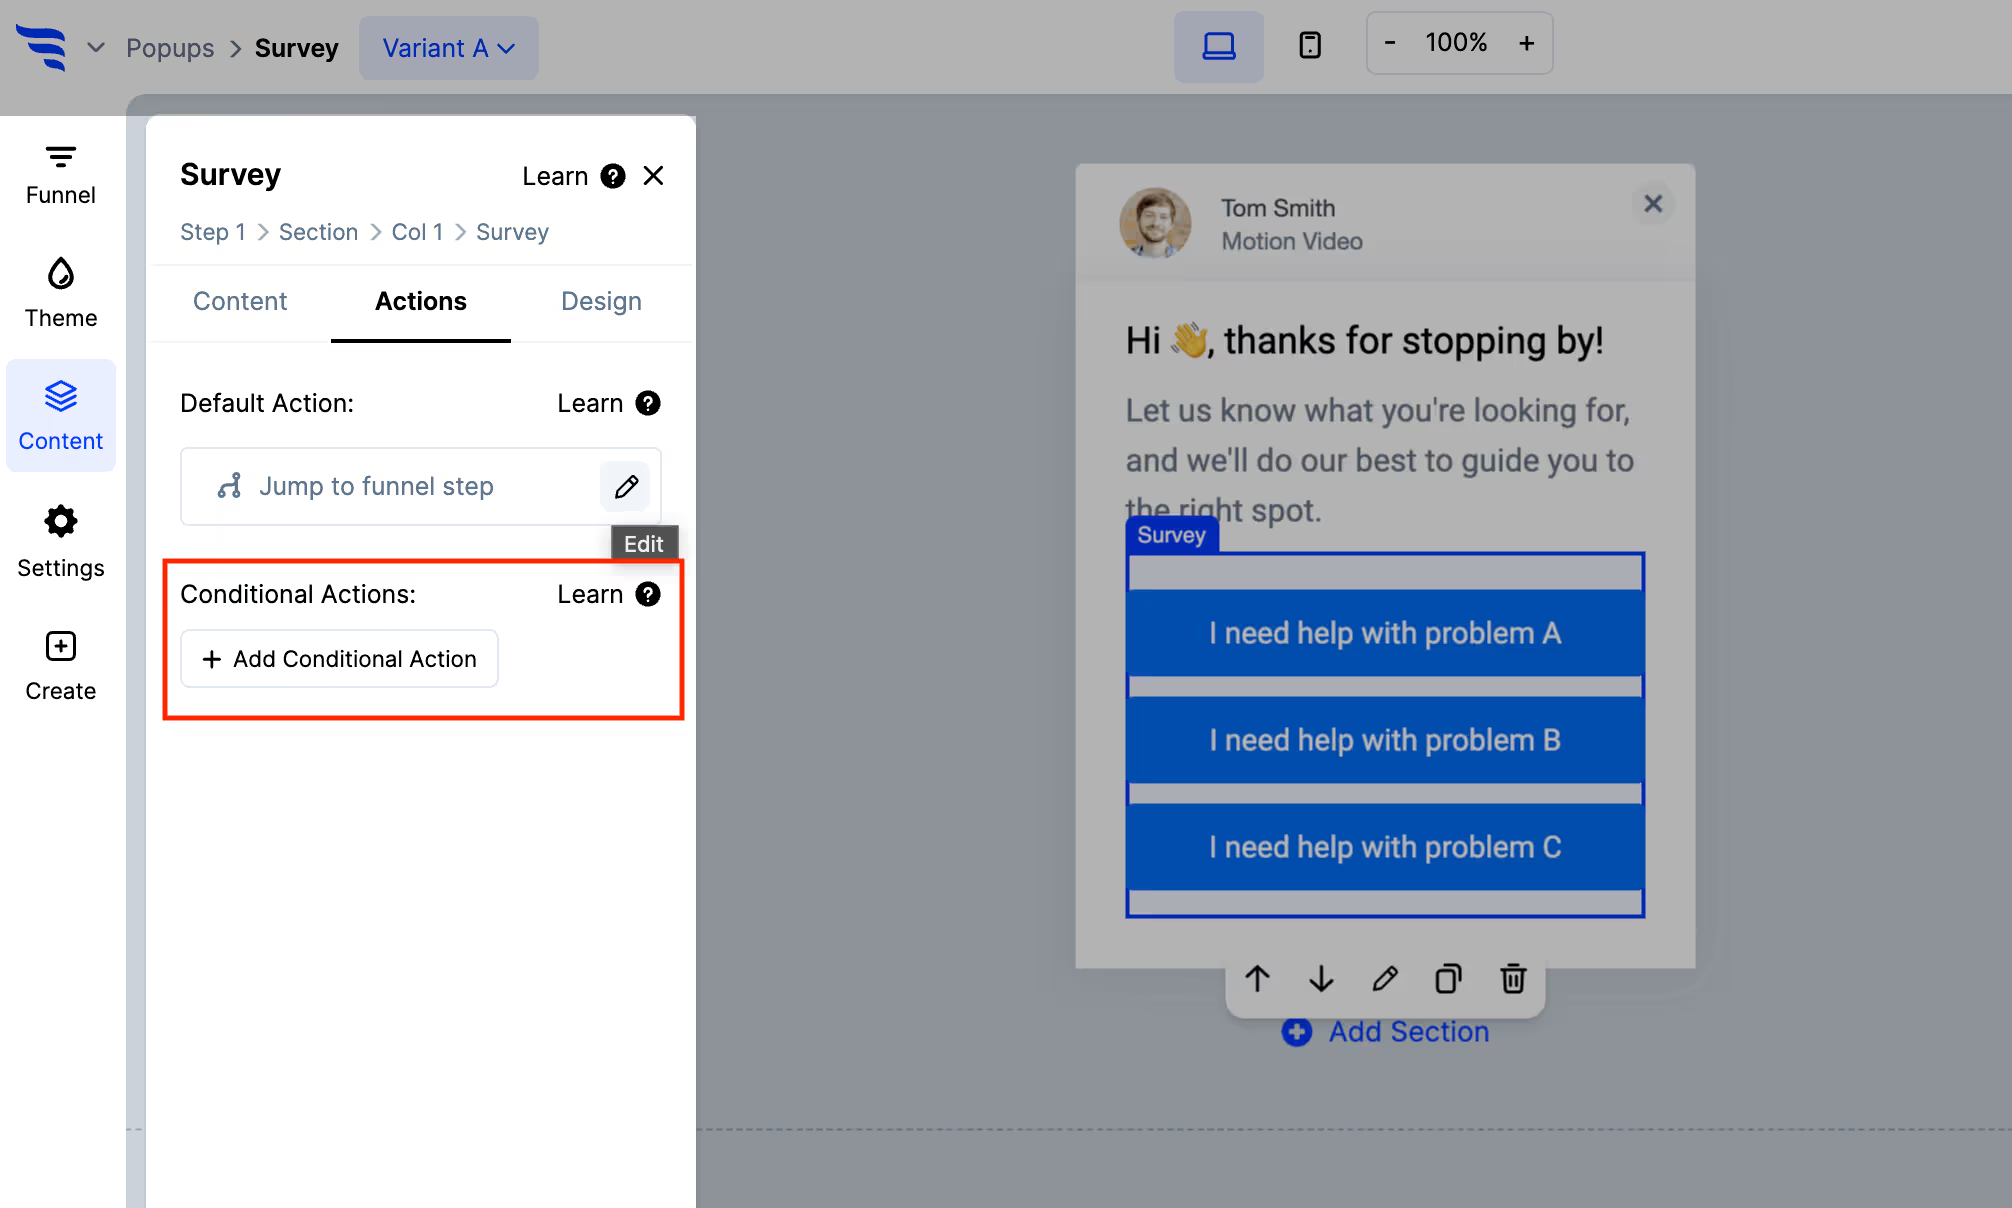
Conditional actions can also follow up — a preference can lead to a matching recommendation on the next step.
Step 6: Read it for what it is
.avif)
Poll results are the least reliable data you'll collect, for good reasons: self-selected respondents, a casual frame, and conformity effects if results were visible.
Use them directionally and for segmentation, not as evidence for a decision that matters. Where you need reliability, ask the same question as a proper survey with results hidden.


%20(1).avif)




.svg)
